Health Effects of Transportation Emission Concentrations in Our Everyday Environment
Comments (0)
December 10th 2019
Cite
Velasco, Manuel, 2019, "Health Effects of Transportation Emission Concentrations in Our Everyday Environment", CARTEEH DATA:HUB, http://carteehdata.org/library/document/health-effects-of-transportation-emission-concentrations-in-our-everyday-environment (accessed Apr 26 2024)
License


Abstract
Assessment of transportation emission exposure in the United States is critical for analyzing and predicting its effects on human health. Many studies have been done on traffic-related pollution exposure; but studies and data that focus on different vehicle concentrations in locations that do not have effective ventilation systems and the effect of those pollutants on human health is still limited. There is little evidence that states whether long-term exposure to high concentrations of transportation emissions in those everyday emission hotspots microenvironments will increase the likelihood of adverse health effects or the risk of mortality. For the existing studies that have been done on the topic, there are vast differences in measuring methods including but not limited to how and what data is recorded. Many of those aspects make it difficult to compare findings between studies and draw conclusions on the risk assessment of those environments. Despite the difference among measuring methods and lack of strict quality control while carrying out exposure assessment, the data will be generalized; and the findings will be compared in hopes to find any linkage between air pollutant concentrations levels from hotspot microenvironments and overall health in the United States. In this paper, exposure assessments studies were gathered and reviewed primarily in the United States on several traffic related air pollutants. The pollutants examined include Particulate Matter (PM), Carbon Monoxide (CO), Ultrafine Particulate Matter (UFP), Polycyclic Aromatic Hydrocarbon (pPAH), Nitrogen Oxides (NOx), Black Carbon (BC), and Benzene. This paper provides an introduction of air pollutant regulations in the United States and the health effects given the measurements identified in some of the studies. The paper also summarizes the limitations and gaps in the recent studies and suggestions for future research to be done in the United States.
Introduction
In the United States, efforts to improve air quality are being made by implementing stricter controls to reduce emissions from motor vehicles. The strategy to reduce these emissions has worked by enforcing emissions standards, pushing the usage of cleaner fuels, and enforcing mandatory vehicle inspection. The rapid growth of motor vehicle fleet, population growth, economic improvement, land use, and an increase of vehicle use dependency creates a challenge for these regulations. There are also locations where the concentration of emissions is being accumulated at a higher rate than they can disperse. An interest in gathering air pollutant concentrations from hotspot microenvironments in the United States is born to find any linkage between the air pollutant concentration levels and overall health of the people.
The study between vehicle emissions and health has been under the focus by the research community, environmental regulatory agencies, and industries to try to find a clear relationship between them. In recent times, some studies of air pollution concentrations created by means of transportation have been analyzed and linked to respiratory and cardiovascular diseases and even mortality. Other studies beg to differ. A recent publication, for example, cites that the link between health and transportation has been suggestive but not sufficient to infer a causal association. A critical examination of microenvironment hotspots for motor emissions may give a clearer understanding of how different concentration levels and different exposure levels go hand in hand with health impacts. It is worthy to note that there are various methods used to obtain air pollutant concentrations, but the main idea is to express the concentrations in measurable values to relate them to places such as parts per million by volume or milligrams per cubic meter. There have been several studies that indicate that the concentration levels of certain pollutants have been well above the regulated levels. What does that mean to the people who work in those environments for hours at a time? Or are exposed to them due to frequency of travel through those locations? Also, what does it mean for the surrounding neighborhoods? And which segment of the population is most prone to be exposed to bad air quality?
The primary pollutants from motor vehicles of most concern to human health are Particulate Matter (PM), Carbon Monoxide (CO), Ultrafine Particulate Matter (UFP), Polycyclic Aromatic Hydrocarbon (pPAH), Nitrogen Oxides (NOx), Black Carbon (BC) and Benzene. Not forgetting the secondary by-products of these pollutants such as ozone and aerosols that will not be covered in this report.
The main objective of this research is to identify and summarize findings from studies where air pollutant concentrations were measured relating to health effects in the United States, and analyze the information to find any consistencies, patterns and trends amongst those studies. These findings will help summarize linkages between air pollutant concentrations levels from hotspot microenvironments and their effects on human health. Using this information, this paper will conclude by summarizing the gaps of the studies and results, and offer suggestions for conducting future research in this area.
Materials, Methods, and Data
Studies on air pollutant concentrations in the United States are not prevalent, especially in relation to human health. This paper summarizes some of the studies identified during a literature review of this topic. An excel document was created to compile the following information from each study: year, location, exposure type, sampling method, duration per measurement, pollutant type, subject or place, unit of measurement used, source of pollutant, and the applicable regulatory standard for that pollutant; a visual display of this information can be seen in Table 1.
Table 1: Compilation of Literature
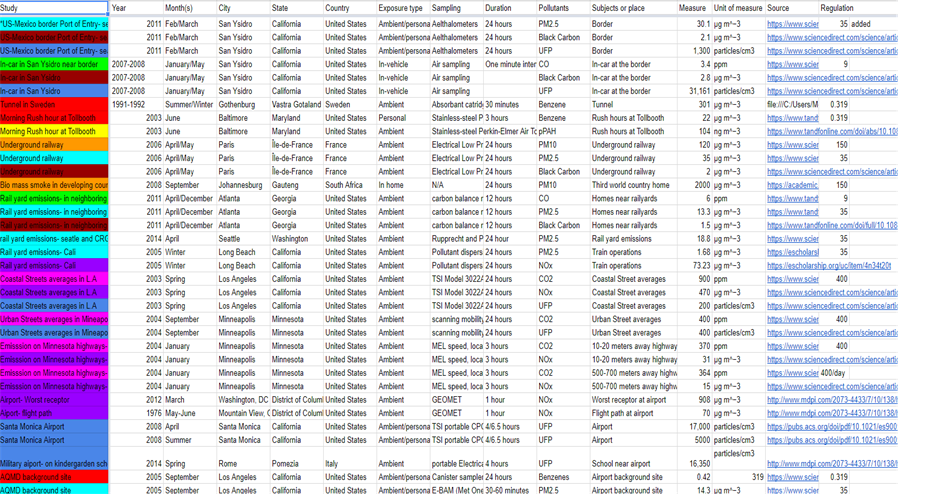
Table 2: 2018 NAAQS Standard
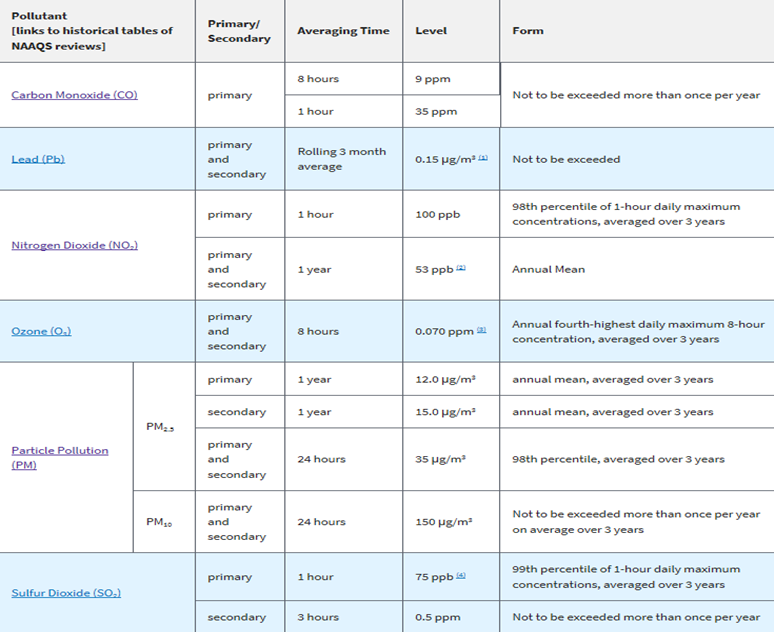
Table 3: Regulatory Values set by OSHA

Results
PM10
A particulate matter (PM10) study was carried out in downtown Belgrade, Kosovo in a commercial parking garage to test out the PM10 concentration levels in 2011. Teflon-coated Quartz filters were placed near the exit of the parking garages for 24 hours at a time during the autumn/winter season. The PM10 values averaged 110 μg/m³ (Vuković, 31). It was found that despite that the PM10 concentration values were below the US EPA daily standard of 150 μg/m³ the concentrations levels were still elevated, and it increased content of cariogenic heavy metals (Cd, Ni, and Pb) which increases the probability of developing cancer to 2%.
Another study was done in an underground car park in Wuhan, China on May 2011. The data was recorded by using polypropylene membrane filters for 14 hours and using the gravimetric method to analyze the data. Average concentrations for PM10 at the entrance and at the exit were respectively 101.3 μg/m³ and 234.4 μg/m³ (Li, 94). Data recorded for the exit surpassed the US EPA daily average. It can be assumed that it can and will bring adverse health effects to the exposed people.
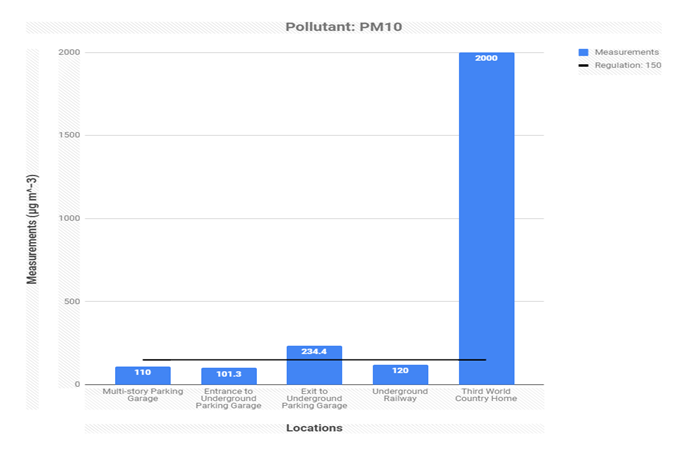
A different study was done in Paris, France in an underground railway station. Measurements were carried out during the months of April and May in 2006 using a nephelometer Model 3563 for 24 hours at a time. The average concentration value obtained for the week-day was 200 μg/m³ which is relatively high (Raut, 860). Investigations were also conducted in two urban locations of El Paso, Texas, during the winter of 1999; these locations were downtown and Chamizal Park. Concentration levels found at downtown and at Chamizal Park were relatively 49 μg/m³ for both locations which happened to be well below the regulatory value (Noble, 827).
In comparison a study on biomass smoke was conducted in Johannesburg, Gauteng on September 2008. The average value for some South African homes was 2,000 μg/m³ (Fullerton, 843), which is more than 10 times the values enforced by the US EPA.
PM2.5
A study analyzing PM2.5 was carried out in an underground car park in Wuhan, China on May 2011. The data was recorded by using polypropylene membrane filters for 14 hours a day and using the gravimetric method to analyze the data. Average concentrations for PM2.5 at the entrance and at the exit were respectively 47.7 μg/m³ and 62.7 μg/m³ (Li, 94). It was found that the PM2.5 concentration values were well above the US EPA daily standard of 35 μg /m³. No health assessment was done for the study, but it should be something that should be researched further as it can be assumed that it can and may bring adverse health effects to the people being exposed.
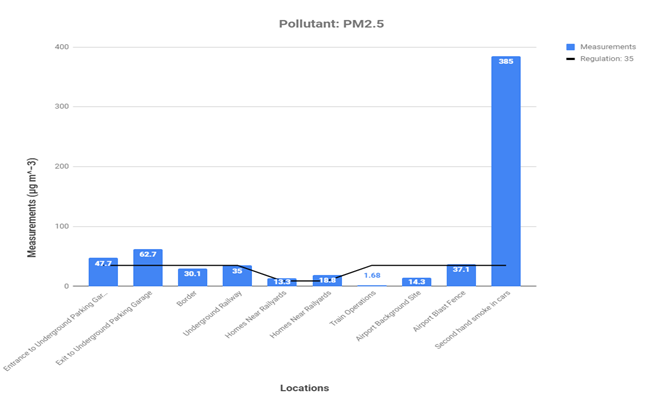
Additionally, a traffic-related air pollution study was done for the community of San Ysidro, California in relation to northbound vehicle wait time at the US-Mexico border Port of Entry(POE) in Feb/March 2011. The PM2.5 concentration level was recorded with active flow personal RAMs (pDRs) and measured an average of 30.1 μg/m³ (Quintana, 353). There is an increase in exposures to traffic-related pollutants in the community near the US-Mexico border due to the proximity of the vehicle wait times. No direct correlation was found in relation to health, but traffic exposures represent an environmental justice issue for the San Ysidro community. Values should be evaluated to health effects to observe how much damage is the community being exposed to.
A different study was done in Paris, France in an underground railway station. Measurements were carried out during April-May 2006 using a nephelometer Model 3563 for 24 hours at a time. The average concentration value obtained for the week-day was 61 μg/m³ which is relatively high. The measurements in that confined space was evaluated to be 5-30 times higher than those measure in Paris streets. A study done in Atlanta, Georgia measured fuel based particulate emissions from a railyard area in 2011. A 1400ab tapered element oscillating microbalance [TEOM] was used to get the concentration value of 13.3 μg/m³ (Galvis, 648). A similar study was conducted to measure diesel particulate matter from in-service rail in Seattle. Washington. The study was carried out in April using an Rupprecht and Patashnick TEOM model to measure out the PM2.5. The average value was a little higher at 18.8 μg/m³ (Jaffe, 344).
An analysis of the health impacts was conducted for PM2.5 emission from train operations in the Alameda Corridor, California in 2005. Researchers linked a pollutant dispersion model (CalPUFF) to a benefit assessment model (BenMAP) to find the mortality from PM exposure. In the research it was concluded that health costs coming solely from PM2.5 exposure was an excess of 40 million dollars annually. A huge number considering the concentration level was 1.68 μg/m³ (Sangkapichai, 2). Another study was done on aircraft emissions and local air quality impacts from takeoff activities at Los Angeles Airport on September 2005. A E-BAM (Met One Instruments) was used to record the data on the background side and blast fence. The obtained values were 14.5 and 37.1 μg/m³ respectively (Zhu, 344).
In comparison, a study of in-car second hand smoke in Edinburgh, Scotland was conducted on summer of 2012. The average value for car journeys of 27 minutes was 385 μg/m³ (Semple 578), which is more than 10 times than the US EPA value of 35 μg/m³.
UFP
In the same study conducted in the community of San Ysidro, California in relation to northbound vehicle Ultrafine Particulate Matter(UFP) concentration levels were recorded with Aethalometers and P-TRAK counters and measured an average of 1,300 particles/cm³ (Quintana, 353). Ultrafine Particulate Matter was also examined in a vehicle near the San Ysidro Mexican border. TSI Condensation Particle Counters were placed inside the vehicles for 24 hours which obtained an average of 200 particles/cm³ (Westerdahl, 3597). A similar study was conducted in September of 2004 in Minneapolis, Minnesota; researchers used scanning mobility particle sizers (SMPS) to obtain an average value of 400 particles/cm³ for urban street averages in Minneapolis (Kittelson, 9).
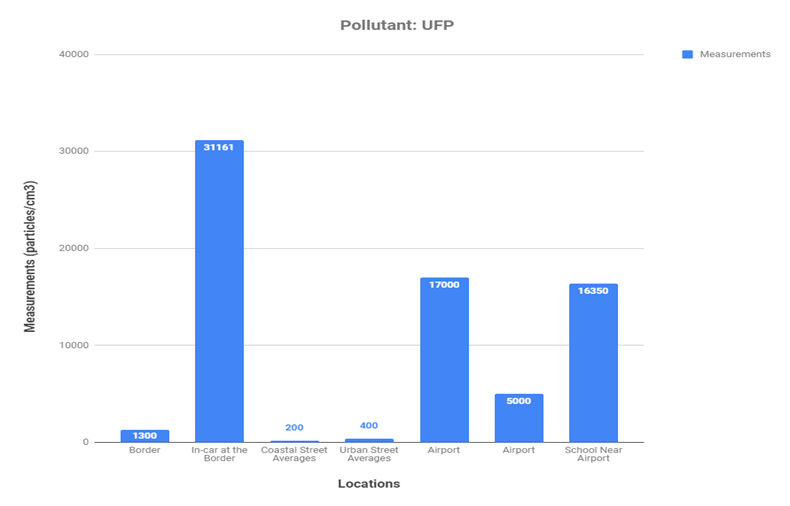
Upon looking at a different study, aircraft emission impacts were studied in a neighborhood adjacent to a general aviation airport in southern California. The study was conducted in April and the summer of 2008. A TSI portable CPC, model 3007 was used to obtain the averages of 17,500 and 500 particles/cm³ for the Santa Monica Airport (Hu, 8039). Studying a different airport, an environmental exposure experiment was carried out nearby a Roman Military Airport in the spring of 2014. Researchers used a portable Electrical Low-Pressure Impactor that was used for 4 hours at a time per day. The average that was obtained from the device was 16,350 particles/cm³ (Campagna, 138).
A study done in El Paso, Texas, in 1999 compared the UFP concentration levels in Downtown and Chamizal Park. The SMPS (TSI Model 3936) and the aerodynamic particle sizer (APS, one TSI Model 3320 and one TSI Model 3310) was used to acquire the values of 13,600 and 14,600 particles/cm³ (Noble, 827). Physical and chemical characterization investigation of Atmospheric Ultrafine Particles was conducted in Pasadena, California where the average was 13,000 particles/cm³ (Hughes, 1153). A study was also done inside school buses in Beeville Texas in 2010 where the measurements of UFP was 34,000 particles/cm³. This measurement was obtained using scanning mobility particle sizer (SMPS 3936L85, TSI Inc., St. Paul, MN) along with a water-based condensation particle counter (WCPC 3785, TSI Inc., St. Paul, MN) in two-minute intervals (Zhang, 253).
In comparison, a study on restaurant cooking smoke was conducted Indian restaurant in San Carlos (Wallace, 20). The average for personal exposure to ultrafine particles in the restaurant was 166,000 particles/cm³ which was nearly 5 times higher than the highest value on the concentration levels in the school bus.
Benzene
The regulatory value limits set by US Occupational Safety and Health Administration (OSHA) (Table 2) for an eight-hour workday is 1 ppm which converts to 0.319 μg/m³ and 5 ppm over any 15-minute period. A Hazard summary provided by the EPA said that being exposed to values ranging from 13 to 45 μg/m³ at a continuous rate, the likelihood of developing cancer would be not greater than one-in-ten thousand. All the values obtained from the studies peaked above the recommended value.
A study analyzing benzene levels in residential vehicle garages in Belgrade, Kosovo in 2011 in relation to health effects was conducted. Passive sampling VOC/PFT was used to get the concentration levels, and the measurements obtained were 13.5 μg/m³. The biggest source of benzene from the garages came from stored gasoline. A similar study was done in commercial parking garage in Baltimore, Maryland using Sorbent tube loaded sequential sampler. The valued obtained from the study was 2.7 μg/m³ (Kim, 291).
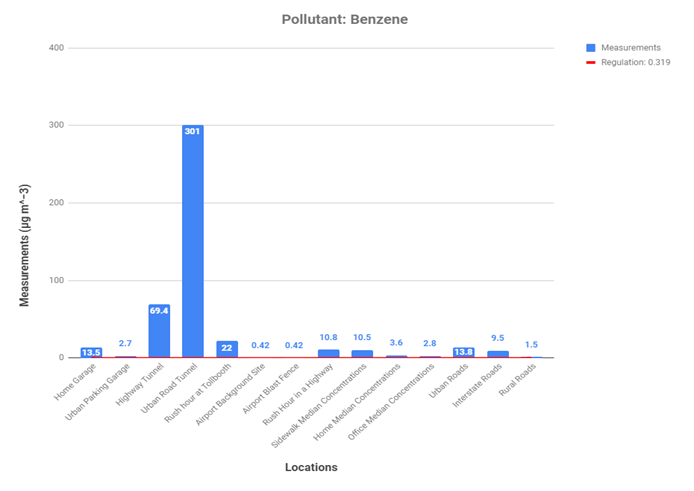
A road tunnel in San Francisco was also evaluated using canister sampling method in 1999. The value obtained was 69.4 μg/m³. Another study was done in Gothenburg during the summer and winter of 1991/92. Researchers studied volatile hazardous hydrocarbons in an Scandinavian urban road tunnel. The concentration levels were relatively high at a 301 μg/m³, and the values were recorded using Adsorbent cartridges in 30-minute intervals (Barrefors, 691). Because of the high concentrations it was found that nearly 200 cancer related cases are associated with benzene exposures.
Another study was done at a Baltimore Toll Booth in June of 2003 to obtain data on the air pollutant concentrations of Benzene. The average value acquired was obtained using a Perkin-Elmer STS-25 sequential sampler and was recorded at 1 μg/m³ (Sapkota, 740). Another study was done on aircraft emissions and local air quality impacts from takeoff activities at Los Angeles Airport on September 2005. A Canister sampler was used to record the airport background site and blast fence; the sampler obtained a value of .42 μg/m³ for both (Zhu, 344). Concentration levels on benzene were also studied in highways in Detroit, Michigan during rush-hour. TO-17 method was used in 10-minute intervals and average value was recorded at 10.8 μg/m³ (Batterman, 6015).
In the winter of 1989 measurements of sidewalks, residential homes, and offices was carried out in Boston, Massachusetts. The tool used was Coconut-based charcoal tubes in one-hour intervals which resulted in averages of 10.5, 3.6 and 2.8 μg/m³ (Chang, 1594). This study shows that benzene concentrations are higher in places where there is more traffic happening; however, like the other studies, only the values were recorded and were not tied any health effect or absolute conclusion. Another study done in Raleigh, North Carolina recorded averages of urban, interstate, and rural roads for 1988. Six-liter Summa polished stainless-steel canisters were used to get the values of 13.8, 9.5, and 1.5 μg/m³ (Chan, 964).
CO
A Carbon Monoxide (CO) study was carried out in downtown Baltimore, Maryland in a commercial parking garage to test out the concentration levels in 2002. An electrochemical sensor was applied to indoor the garage using real-time monitors with one-minute resolutions for 30 minutes at a time. The CO values averaged at 2.6 ppm (Vuković, 31). CO was also examined in a vehicle near the San Ysidro Mexican borders. HOBO Carbon Monoxide Data Logger were placed inside the vehicles for one-minute intervals which obtained an average of 3.4 ppm (Westerdahl, 3597).
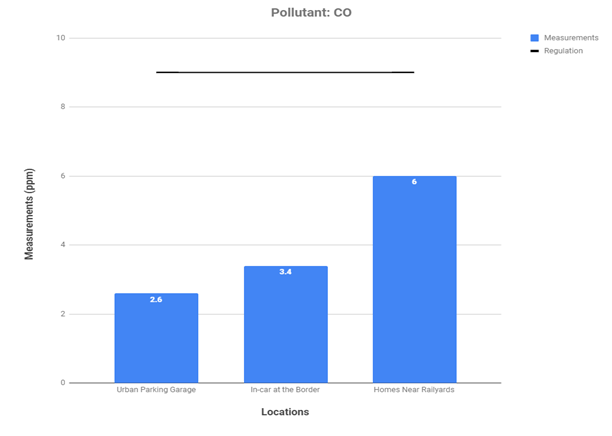
A study was done in Atlanta, Georgia measuring fuel based particulate emissions from a railyard area in 2011. A multi-angle absorption photometer [MAAP], model 5012, was used for 12 hours per day between April-December to get the concentration values of 6 ppm (Galvis, 648). All the values picked up in the studies were below the regulated value of 9 ppm which is the NAAQS standard (Table 1).
Black Carbon
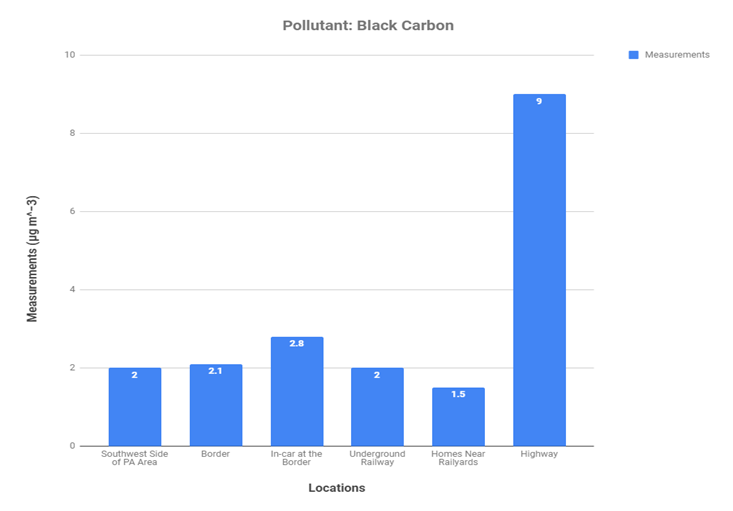
Summertime hourly Black Carbon measurements were carried out in Uniontown, Pennsylvania in 1990. Aethalometer, a semi continuous optical absorption method was used every 3 hours to get an average of 2 μg/m³. In the car exterior at the San Ysidro border the Black Carbon concentration levels were recorded with Aethalometers and measured an average of 2.1 μg/m³(Quintana, 353). Black Carbon was also examined in vehicles near the San Ysidro Mexican borders. Aethalometer, model AE42, was placed inside the vehicles for one-minute intervals which obtained an average of 2.8 μg/m³ (Westerdahl, 3597). The study conducted in the underground railway station in Paris used Electrical Low-Pressure Impactor for 24 hours. The average concentration value obtained for the weekday was 2 μg/m³ which also shows to be up to 30 times higher than the concentrations on the streets (Raut, 860). Black Carbon concentrations were also measure in Sacramento California in highways for the Fall of 1997. Model AE16 Aethalometer was used to get an average of 9 μg/m³ (Fruin, 4123).
NOx:
In the study conducted for meission from train operations in the Alameda Corridor, Nitrogen Oxide (NOx) was also gathered. In the research it was concluded that health costs coming solely from NOx exposure was 8 million dollars annually. A huge number considering the concentration level was 73.23 μg/m³ (Sangkapichai, 2). A study was done in Los Angeles, California where a mobile platform measured NOx concentrations on freeways and residential streets. To acquire the measurements, the Teledyne-API NOx analyzer, model 200e, was used and collected an average of 470 μg/m³. The experiment was carried out in the spring and they were measured in 20 second intervals.
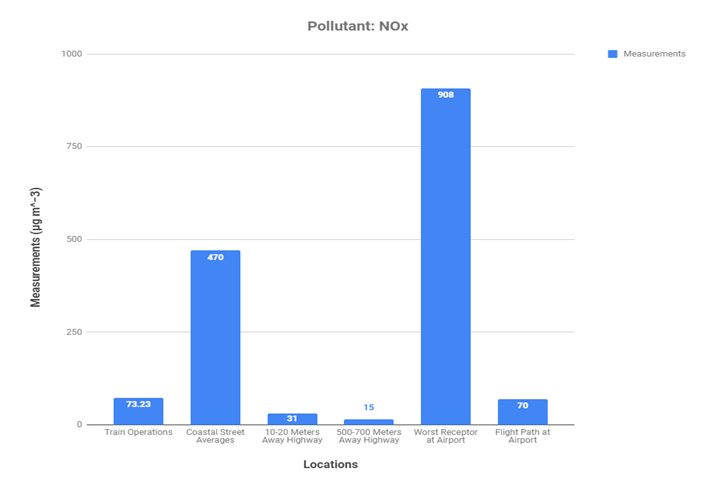
NOx concentration levels were also made on Minneapolis highways on January 2004. The study measured averages of 10-20 meters away from the highway and 500-700 meters from the highways Essentially the average was 31 and 15 μg/m³ noting that the concentrations were higher at places closer to the highway bringing a potential problem to the communities nearby (Kittelson, 9).
Another study was done on March 2012 at the Ronald Reagan Washington airport using a GEOMET in one-hour intervals. The scientist measured the average for the worse receptor at the airport which was a value of 908 μg/m³ (Jordan, 119). Despite that there are no regulations or direct human health impacts, it was the highest value acquired. Lastly, an airport in Mountain View, GA conducted a similar study between May and June in 1976 where they measured NOx at a flight path; the results measured at 70 μg/m³ (Jordan, 124). Both studies gathered the measurements in one-hour intervals.
pPAH:
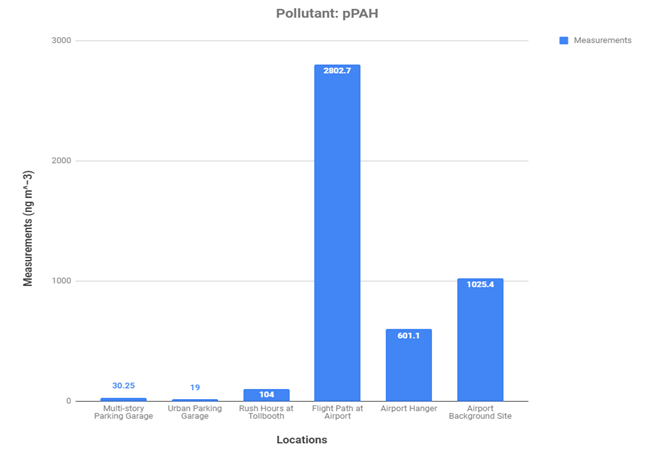
A particulate polycyclic aromatic hydrocarbons(PAH) pPAH study was carried out in downtown Belgrade, Kosovo in a commercial parking garage to test out the concentration levels in in 2011. Sphagnum girgensohnii moss bags were placed in different parts of the parking garage for weeks at a time during the autumn/winter season. The pPAH values averaged 30.25 ng/m³ (Vuković, 31). Another pPAH study was carried out in downtown Baltimore, Maryland in a commercial parking garage to test out the pPAH concentration levels in 2002. A direct reading monitor and logger was applied inside the garage for 21 minutes at a time. The pPAH values averaged at 19 ng/m³ (Kim, 291). It was found that despite the pPAH concentration values were lower limit value of the acceptable range of 10^-4 to 10^-6 there was still a 2% probability of developing cancer. Another study was done at a Baltimore Toll Booth in June of 2003 to obtain data on the air pollutant concentrations of pPAH. The average value acquired was 104 ng/m³, which was obtained by using a Ecochem PAS 2000 PAH Ambient Analyzer (Sapkota, 740). Lastly, a real-time and integrated measurement of potential human exposure to particle-bound pPAHs from aircraft exhaust were analyzed in May 1999 in the Air National Guard airport in Northern California. Three locations measured were the flightpath, airport hangar and airport background which resulted in the averages of 2802.7, 601.1, and 1025.4 ng/m³ (Childers, 853). The data was recorded using PAS10002i; the PAS2000; and the PAS2000CE in one-hour intervals.
Conclusion/Recommendations
The studies conducted and results found were not sufficient in order to give some relationship between concentration levels and health effects. An analysis of the data compiled from the literature review showed the challenge of generalizing and comparing findings between studies. A major reason for this is the variety of the data; specifically, a difference amongst sampling methods and general lack of uniform protocol while carrying out exposure assessment studies. The ambient concentration levels were also not recorded or identified to further analyze how high those concentration levels were in context of the cleaner air. There were also not enough studies conducted and/or found in the United States in order to analyze our current concentration levels in relation to health. Another issue within the data was that there were too many concentration levels trying to be compared at a time.
Completing the following would better serve for future researchers. Simply focus creating a health index in order to compare how different levels of pollutants are related in regard to human health. It was also unavoidable to realize that the measurements obtained are significantly low to emission levels of other sources such as biomass fuels, cooking, smoking, and many more. It is something that should be evaluated with greater detail. Furthermore, development in concentrations of air pollution emissions regardless of the source can bring a more obvious relationship between different concentrations and health.
Acknowledgements
I want to thank The Center for Advancing Research in Transportation Emissions, Energy, and Health (CARTEEH) for funding TTI and giving me the opportunity to engage in research relating transportation emissions, air quality and human health. I want to thank the staff from TTI specially: Dr. Dan Seedah, Dr. Laura Higgins, Dr. Andrew Birt who were always there when I needed help in the process and many more things beyond the project. They all served as great mentors. Lastly, I also want to thank my friend Jose Palacios for all his help in the project as well.
Bibliography
- McCollister, George M., and Kent R. Wilson. "Linear stochastic models for forecasting daily maxima and hourly concentrations of air pollutants." Atmospheric Environment (1967) 9.4 (1975): 417-423.
- Health Effects Institute. Panel on the Health Effects of Traffic-Related Air Pollution. Traffic-related air pollution: a critical review of the literature on emissions, exposure, and health effects. No. 17. Health Effects Institute, 2010.
- Zhu, Yifang, et al. "Aircraft emissions and local air quality impacts from takeoff activities at a large International Airport." Atmospheric Environment 45.36 (2011): 6526-6533.
- Vuković, Gordana, et al. "Air quality in urban parking garages (PM10, major and trace elements, PAHs): Instrumental measurements vs. active moss biomonitoring." Atmospheric environment 85 (2014): 31-40.
- Li, Yaxuan, and Rongbiao Xiang. "Particulate pollution in an underground car park in Wuhan, China." Particuology 11.1 (2013): 94-98.
- Raut, J-C., Patrick Chazette, and A. Fortain. "Link between aerosol optical, microphysical and chemical measurements in an underground railway station in Paris." Atmospheric Environment 43.4 (2009): 860-868.
- Noble, Christopher A., et al. "Continuous measurement of fine and ultrafine particulate matter, criteria pollutants and meteorological conditions in urban El Paso, Texas." Atmospheric Environment 37.6 (2003): 827-840.
- Fullerton, Duncan G., Nigel Bruce, and Stephen B. Gordon. "Indoor air pollution from biomass fuel smoke is a major health concern in the developing world." Transactions of the Royal Society of Tropical Medicine and Hygiene 102.9 (2008): 843-851.
- Quintana, Penelope JE, et al. "Traffic-related air pollution in the community of San Ysidro, CA, in relation to northbound vehicle wait times at the US–Mexico border Port of Entry." Atmospheric Environment 88 (2014): 353-361.
- Galvis, Boris, Mike Bergin, and Armistead Russell. "Fuel-based fine particulate and black carbon emission factors from a railyard area in Atlanta." Journal of the Air & Waste Management Association 63.6 (2013): 648-658.
- Jaffe, Daniel A., et al. "Diesel particulate matter emission factors and air quality implications from in–service rail in Washington State, USA." Atmospheric Pollution Research 5.2 (2014): 344-351.
- "DFG, German Research Foundation." http://www.dfg.de/en/. Accessed 30 Jul. 2018.
- Zhu, Yifang, et al. "Aircraft emissions and local air quality impacts from takeoff activities at a large International Airport." Atmospheric Environment 45.36 (2011): 6526-6533.
- Semple, Sean, et al. "Secondhand smoke in cars: assessing children's potential exposure during typical journey conditions." Tobacco control 21.6 (2012): 578-583.
- Quintana, Penelope JE, et al. "Traffic-related air pollution in the community of San Ysidro, CA, in relation to northbound vehicle wait times at the US–Mexico border Port of Entry." Atmospheric Environment 88 (2014): 353-361.
- Westerdahl, Dane, et al. "Mobile platform measurements of ultrafine particles and associated pollutant concentrations on freeways and residential streets in Los Angeles." Atmospheric Environment 39.20 (2005): 3597-3610.
- Kittelson, David B., Winthrop F. Watts, and Jason P. Johnson. "Nanoparticle emissions on Minnesota highways." Atmospheric Environment 38.1 (2004): 9-19.
- Hu, Shishan, et al. "Aircraft emission impacts in a neighborhood adjacent to a general aviation airport in Southern California." Environmental science & technology43.21 (2009): 8039-8045.
- Campagna, Marcello, et al. "Environmental exposure to ultrafine particles inside and nearby a military airport." Atmosphere 7.10 (2016): 138.
- Noble, Christopher A., et al. "Continuous measurement of fine and ultrafine particulate matter, criteria pollutants and meteorological conditions in urban El Paso, Texas." Atmospheric Environment 37.6 (2003): 827-840.
- Hughes, Lara S., et al. "Physical and chemical characterization of atmospheric ultrafine particles in the Los Angeles area." Environmental Science & Technology 32.9 (1998): 1153-1161.
- Zhang, Qunfang, and Yifang Zhu. "Measurements of ultrafine particles and other vehicular pollutants inside school buses in South Texas." Atmospheric Environment 44.2 (2010): 253-261.
- Wallace, Lance, and Wayne Ott. "Personal exposure to ultrafine particles." Journal of Exposure Science and Environmental Epidemiology 21.1 (2011): 20.
- "Benzene - EPA." https://www.epa.gov/sites/production/files/2016-09/documents/benzene.pdf. Accessed 18 Jul. 2018.
- Barrefors, Gunnar, and Göran Petersson. "Volatile hazardous hydrocarbons in a Scandinavian urban road tunnel." Chemosphere 25 (1992): 691-696.
- Sapkota, Amir, and Timothy J. Buckley. "The mobile source effect on curbside 1, 3-butadiene, benzene, and particle-bound polycyclic aromatic hydrocarbons assessed at a tollbooth." Journal of the Air & Waste Management Association 53.6 (2003): 740-748.
- Batterman, Stuart A., Chung-Yu Peng, and James Braun. "Levels and composition of volatile organic compounds on commuting routes in Detroit, Michigan." Atmospheric Environment 36.39-40 (2002): 6015-6030.
- Chan, Chang-Chuan, et al. "Commuter exposures to VOCs in Boston, Massachusetts." Journal of the Air & Waste Management Association 41.12 (1991): 1594-1600.
- Chan, Chang Chuan, et al. "Driver exposure to volatile organic compounds, carbon monoxide, ozone and nitrogen dioxide under different driving conditions." Environmental science & technology 25.5 (1991): 964-972.
- Westerdahl, Dane, et al. "Mobile platform measurements of ultrafine particles and associated pollutant concentrations on freeways and residential streets in Los Angeles." Atmospheric Environment 39.20 (2005): 3597-3610.
- Galvis, Boris, Mike Bergin, and Armistead Russell. "Fuel-based fine particulate and black carbon emission factors from a railyard area in Atlanta." Journal of the Air & Waste Management Association 63.6 (2013): 648-658.
- Quintana, Penelope JE, et al. "Traffic-related air pollution in the community of San Ysidro, CA, in relation to northbound vehicle wait times at the US–Mexico border Port of Entry." Atmospheric Environment 88 (2014): 353-361.
- Westerdahl, Dane, et al. "Mobile platform measurements of ultrafine particles and associated pollutant concentrations on freeways and residential streets in Los Angeles." Atmospheric Environment 39.20 (2005): 3597-3610.
- Raut, J-C., Patrick Chazette, and A. Fortain. "Link between aerosol optical, microphysical and chemical measurements in an underground railway station in Paris." Atmospheric Environment 43.4 (2009): 860-868.
- Fruin, Scott A., Arthur M. Winer, and Charles E. Rodes. "Black carbon concentrations in California vehicles and estimation of in-vehicle diesel exhaust particulate matter exposures." Atmospheric Environment 38.25 (2004): 4123-4133.
- Kittelson, David B., Winthrop F. Watts, and Jason P. Johnson. "Nanoparticle emissions on Minnesota highways." Atmospheric Environment 38.1 (2004): 9-19.
- Jordan, Bruce C., and Anthony J. Broderick. "Emissions of oxides of nitrogen from aircraft." Journal of the Air Pollution Control Association 29.2 (1979): 119-124.
- Vuković, Gordana, et al. "Air quality in urban parking garages (PM10, major and trace elements, PAHs): Instrumental measurements vs. active moss biomonitoring." Atmospheric environment 85 (2014): 31-40.
- Kim, Sung R., Francesca Dominici, and Timothy J. Buckley. "Concentrations of vehicle-related air pollutants in an urban parking garage." Environmental Research 105.3 (2007): 291-299.
- Sapkota, Amir, and Timothy J. Buckley. "The mobile source effect on curbside 1, 3-butadiene, benzene, and particle-bound polycyclic aromatic hydrocarbons assessed at a tollbooth." Journal of the Air & Waste Management Association 53.6 (2003): 740-748.
- Childers, Jeffrey W., et al. "Real-time and integrated measurement of potential human exposure to particle-bound polycyclic aromatic hydrocarbons (PAHs) from aircraft exhaust." Environmental Health Perspectives 108.9 (2000): 853.